A quick review of Prometheus
by yaobin.wen
This article is a quick review of Prometheus to help refresh memory after a long time of not using it. Because this is a review, I assume the readers (most likely, me myself) had already learned how to use Prometheus before.
Documentation
Prometheus documentation is good because it not only teaches the users how to use the product but also helps the users to understand it conceptually. If you want to quickly refresh your memory of Prometheus, I suggest to read the following sections:
- Overview, especially the sections “Features”, “Components”, and “Architecture”. More importantly, the “When does it fit?” and “When does it not fit?”.
- Concepts, including “Data Model”, “Metric Types”, and “Jobs and instances”.
- Querying.
- Operating, especially the section “Security”.
- Best Practices.
Concepts
Prometheus uses the following important concepts.
The first one is time series. Simply put, it is a stream of values over time. On a 2D plane, the horizontal axis is time and the vertical axis is the values.
The values, as the “When does it fit?” section mentions, are (supposed to be) purely numeric. They are the numeric measurement of a particular object, such as the temperature, the number of arithmetic operations, or the size of the free disk space.
Therefore, these “objects” must be measurable. Note that what sounds measurable in a daily conversation may not really be measurable to Prometheus. For example, nowadays a computer usually has multiple CPU cores. Although it makes some sense when we talk about “CPU frequency” in oral discussion, when it comes to measurement, we can’t measure “CPU frequency” but the frequency of a particular CPU core. The reason is “CPU frequency” is not a simple addition of the frequencies of all the CPU cores. In this example, “CPU frequency” sounds more like the name that we call a group of measurable objects that have similar traits.
Before we move on, we must discuss another example: free disk space. On a computer may have multiple hard drives, the “free disk space” can be calculated by simply adding the free disk spaces of all hard drives. We can still treat “free disk space” as the name we call a group of similar measurable objects (i.e., every concrete hard drive).
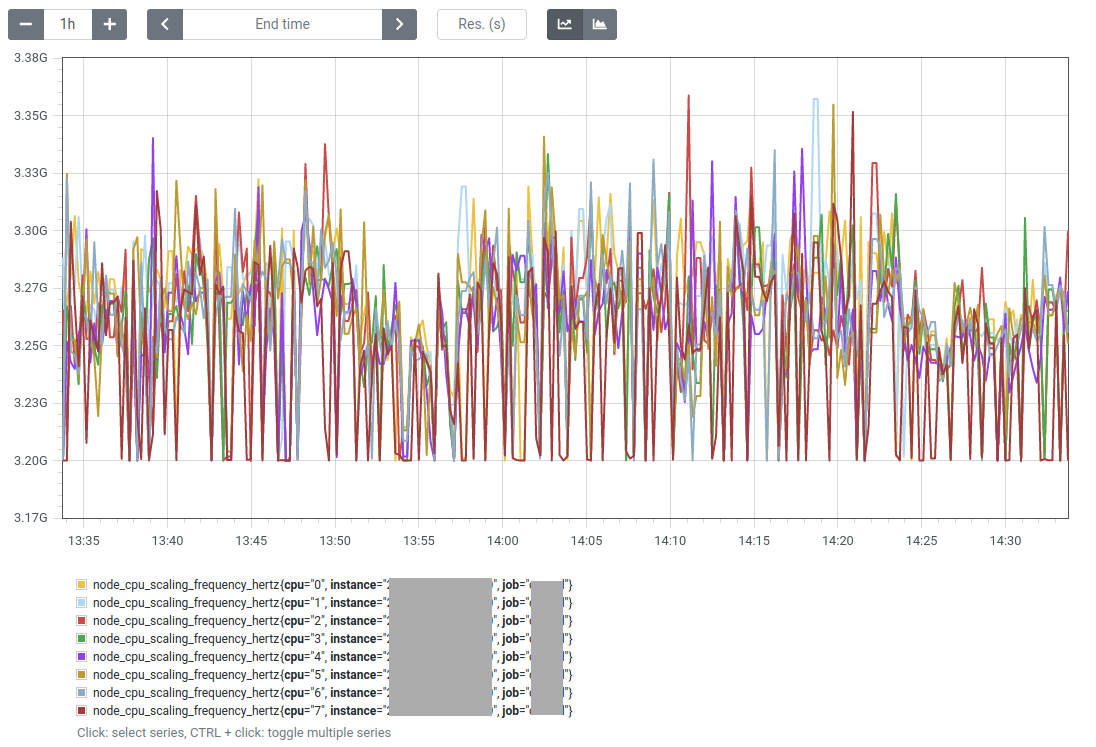
Nonetheless, Prometheus uses the term “metric name” to refer to those group names like “CPU frequency” or “free disk space”. According to this definition of, a metric may or may not be directly measurable. Prometheus uses “labels” to further break down each metric into measurable entities. For example, node_cpu_scaling_frequency_hertz is the metric name but its labels divide it further into every CPU core:
This is also why the “Data Model” section defines “time series” the following way:
Every time series is uniquely identified by its metric name and optional key-value pairs called labels.
Note the word “optional”. It means the design of “labels” give the metric implementers great flexibility to choose how to define their metrics. They can group a set of similar measurable objects and use one metric name to call them, but nothing prevents them from defining one metric for every measurable object.
Querying
There are two types of queries:
- Instant query: A query of values of a particular moment. This yields an “instant vector”.
- Range query: A query of values over a period of time. This yields a “range vector”.
How to issue a query:
| Query | Type | Time | Description |
|---|---|---|---|
http_requests_total |
Instant | Current moment | Query the whole metric and return values of all labels. |
http_requests_total{method="GET"} |
Instant | Current moment | Query the particularly labeled values. |
http_requests_total @ 1609746000 |
Instant | Particular moment | Query the values at Unix timestamp 1609746000 (i.e., 2021-01-04T07:40:00+00:00). |
http_requests_total{method="GET"}[5m] |
Range | [-5m, now] | Query the values over the past 5 minutes. |
http_requests_total[5m] offset 1w |
Range | [-5m-1w, -1w] | Query the values over the past 5 minutes, one week ago. |
http_requests_total[5m] offset -1w |
Range | [-5m+1w, +1w] | Query the values over the past 5 minutes, one week in the future. |
Also check out the following sections:
Tags: Tech - Cloud